We love our Performance Dashboard. It took rounds of development to get it to where it is today. We consistently receive great feedback from our users about the Performance Dashboard. They all love the amount of data widgets that we’ve included!
In this post, we’ll explore the following widgets – Cleaning Fees, Extra Person Fees, Cancellation Policies, Bookings, Cancellations, and Bookings vs Lead Time.
Performance Dashboard Widgets Continued…
Cleaning Fees
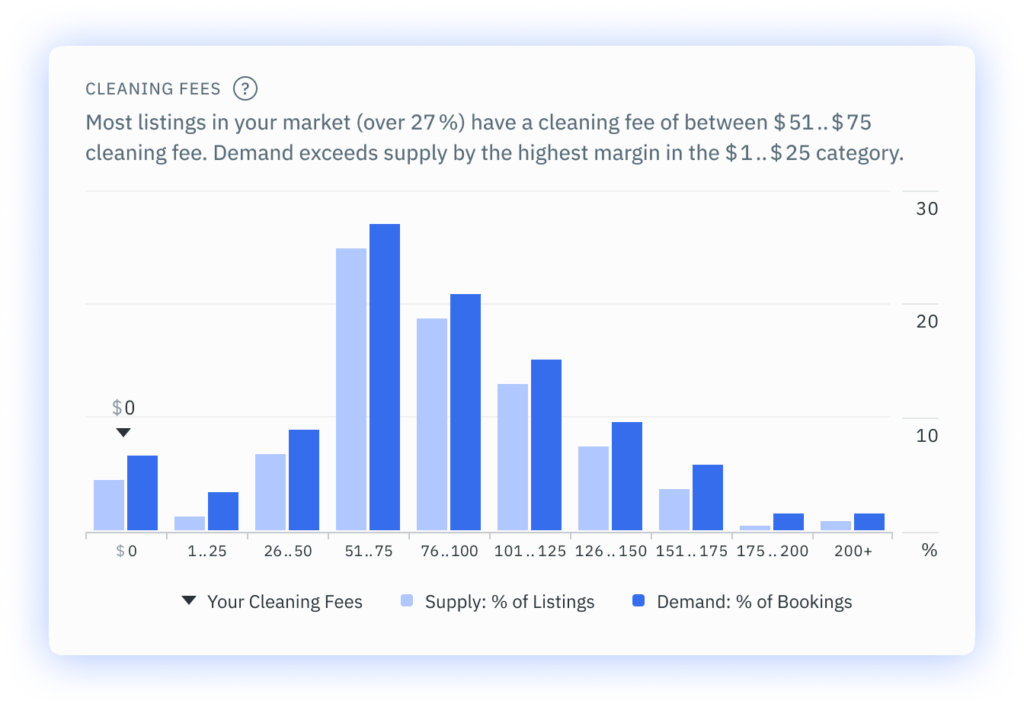
Hosts are often flummoxed at what to charge as a cleaning fee. It was such a common question that we decided to write an entire post about it! You can view that post here. Deciding on a cleaning fee for your Airbnb is complicated if you don’t have any information on what the rest of your local market is charging. It may not sound like it, but if your cleaning fee is exponentially higher than that of your competitors, then you might price yourself out of contention for bookings. On the flip side, if your cleaning fee is too low, you could be losing profits unnecessarily.
Extra Person Fees
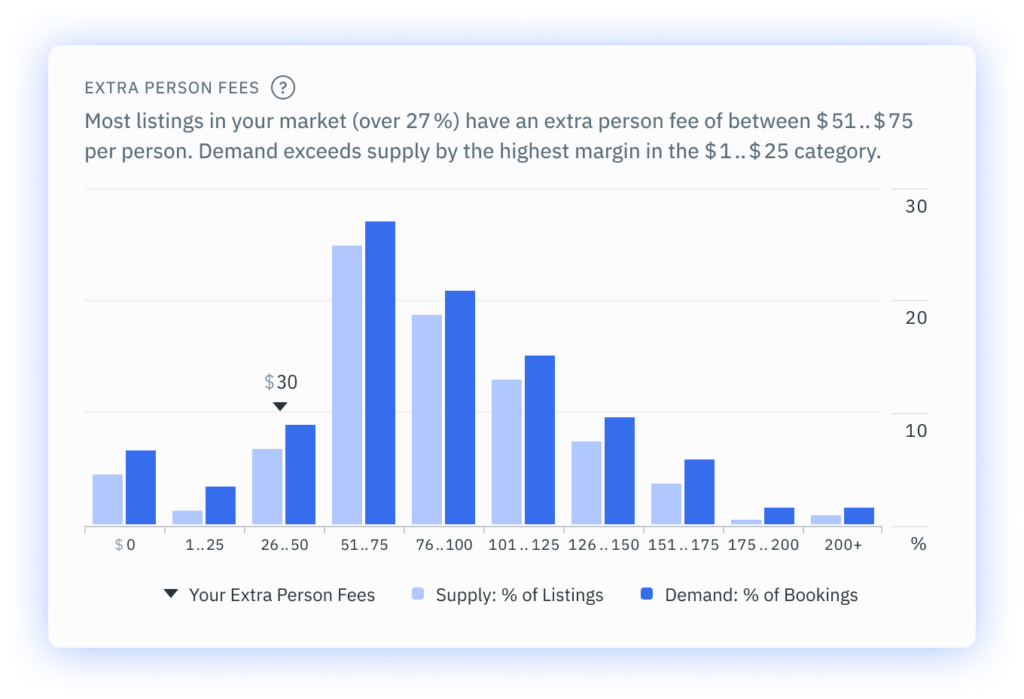
The number of people that a listing can accommodate is often a critical concern for those guests travelling in larger groups. But what can we learn from the amount that hosts charge to add an extra person to a booking? Well, this widget helps hosts set their extra person fees at the same level as the rest of the market. In an increasingly competitive market, every little thing makes a difference, and the amount you charge as an extra person fee is no different.
Cancellation Policies
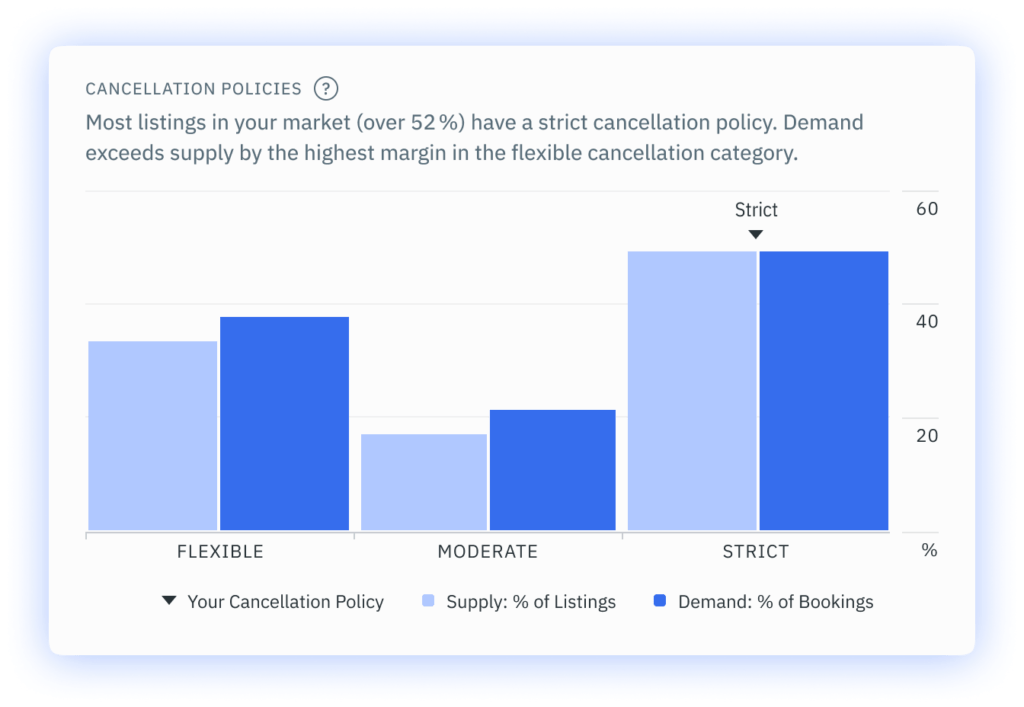
Cancellation policies have been hugely important during the last two years. Our helpful Performance Dashboard widget shows what percentage of listings are operated under each of the three cancellation policies. Plus what percentage of bookings were made using those specific policies for the next 30 days. Any changes in these graphs will illustrate how guest demands are changing. It will provide insight into whether your cancellation policy could be costing you bookings.
For hosts who have selected the new ‘Firm’ cancellation policy, rest assured that we’re adding this data to the Cancellation Policy widget soon!
Bookings
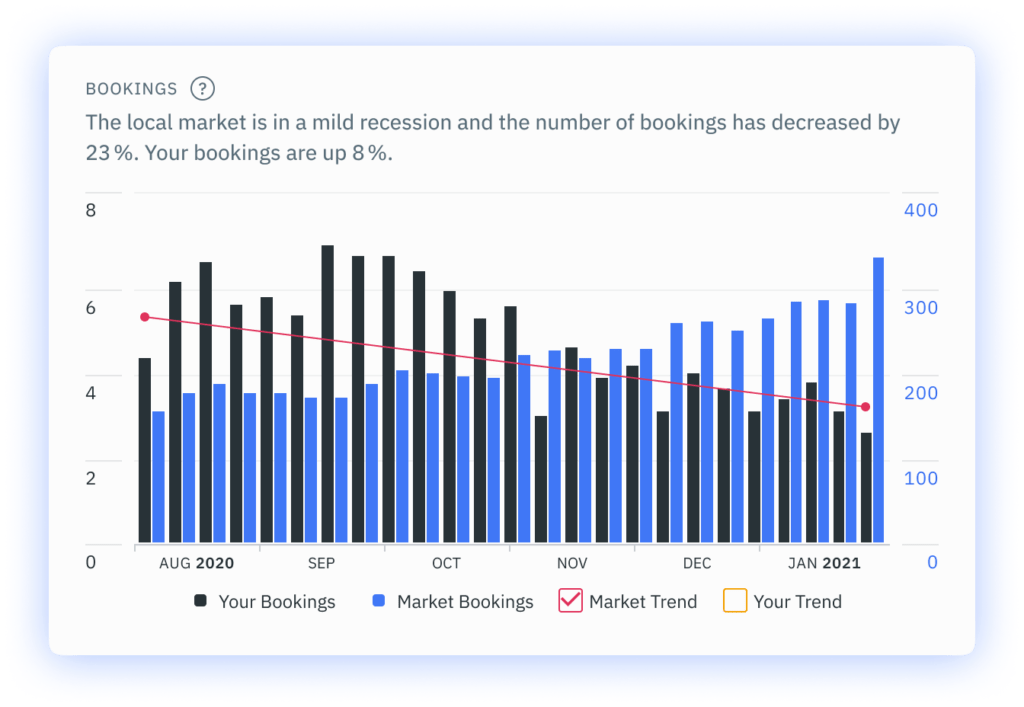
Our Bookings widget shows the number of new bookings that were made each week ending on the indicated date. We’ve combined both the data from your listing and the data from your greater local market. We’ve also added a feature that means you can see both your booking rate trend and the booking rate trend of the market around you. We want to make sure that your pricing is keeping you in the fight for bookings and our Bookings widget will tell you whether or not you’re succeeding!
Cancellations
Nobody wants guests to cancel, but sadly it’s unavoidable. The Cancellations widget shows the total number of cancelled bookings that occurred in the stipulated period. You can choose to view this data in a 30 day, 3 months, or 1 year period. Like most of our other widgets, we also included comparable data to the wider local market.

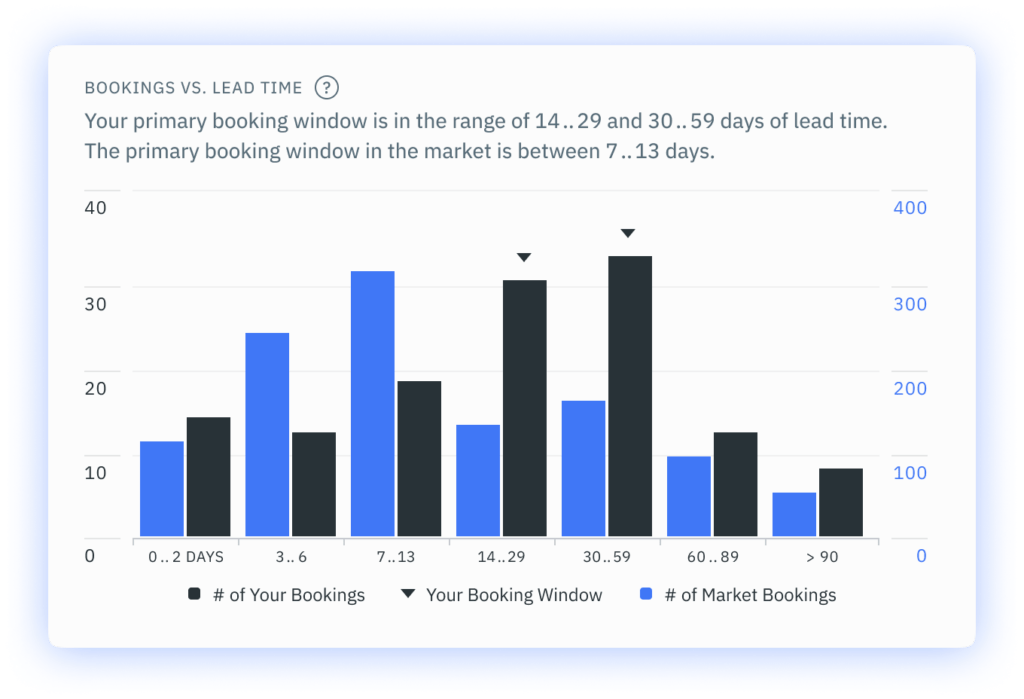
Bookings vs Lead Time
Both Bookings and Lead Time are important figures when it comes to accessing how optimized your listing is for bookings in your local market. Our graph shows the number of bookings in different lead time categories over the past 30 days. The lead time sections are 0-2 days, 3-6 days, 7-13 days, 14-29 days, 30-59 days, 60-89 days, and >90 days. We’ve included data from both your listing and the greater local market to give you a better picture of the entire Bookings vs Lead Time picture.
How Can I Access the DPGO Performance Dashboard?
We offer a range of payment options for our users, so head to our website now to see which plan is right for you! Register for DPGO now by clicking on the banner below and creating your account! We’re offering all new users a free 30-day trial to experience the amazing benefits of DPGO dynamic pricing for themselves!

Comments are closed.